Tracing Model
The project's API makes no assumption on the model used by it's implementation. However, the main OpenTracing based implementation relies on the Span model.
Spans and Trees
The Span nodel is nothing more than a tree of nodes called Spans. Each Span is simply a small data structure that represents a fraction of the execution of any given request. This model was originally designed for distributed systems based on RPC, and as such the edges represented service-activation, however you can view them as the activation of a new service, method, fraction of code, etc.
Hierarchical Structure
Given that it's based on a tree, each trace will have a root Span that represents the beginning of a request's execution, think of this first span as the entry-point. Calls to other traced methods will become children of the root, calls from the children to other methods will become the children's children and so on. In the end a trace will resemble a distributed call tree that shows you the request path.
Span Metadata
Spans contain a traceID, a spanID and parentId and key-value pairs called annotations. The annotations can be defined by the programmer, however there are two annotations which are present in every span: the start and end timestamp. This means that through tracing it is possible to view how long the request spent in each component.
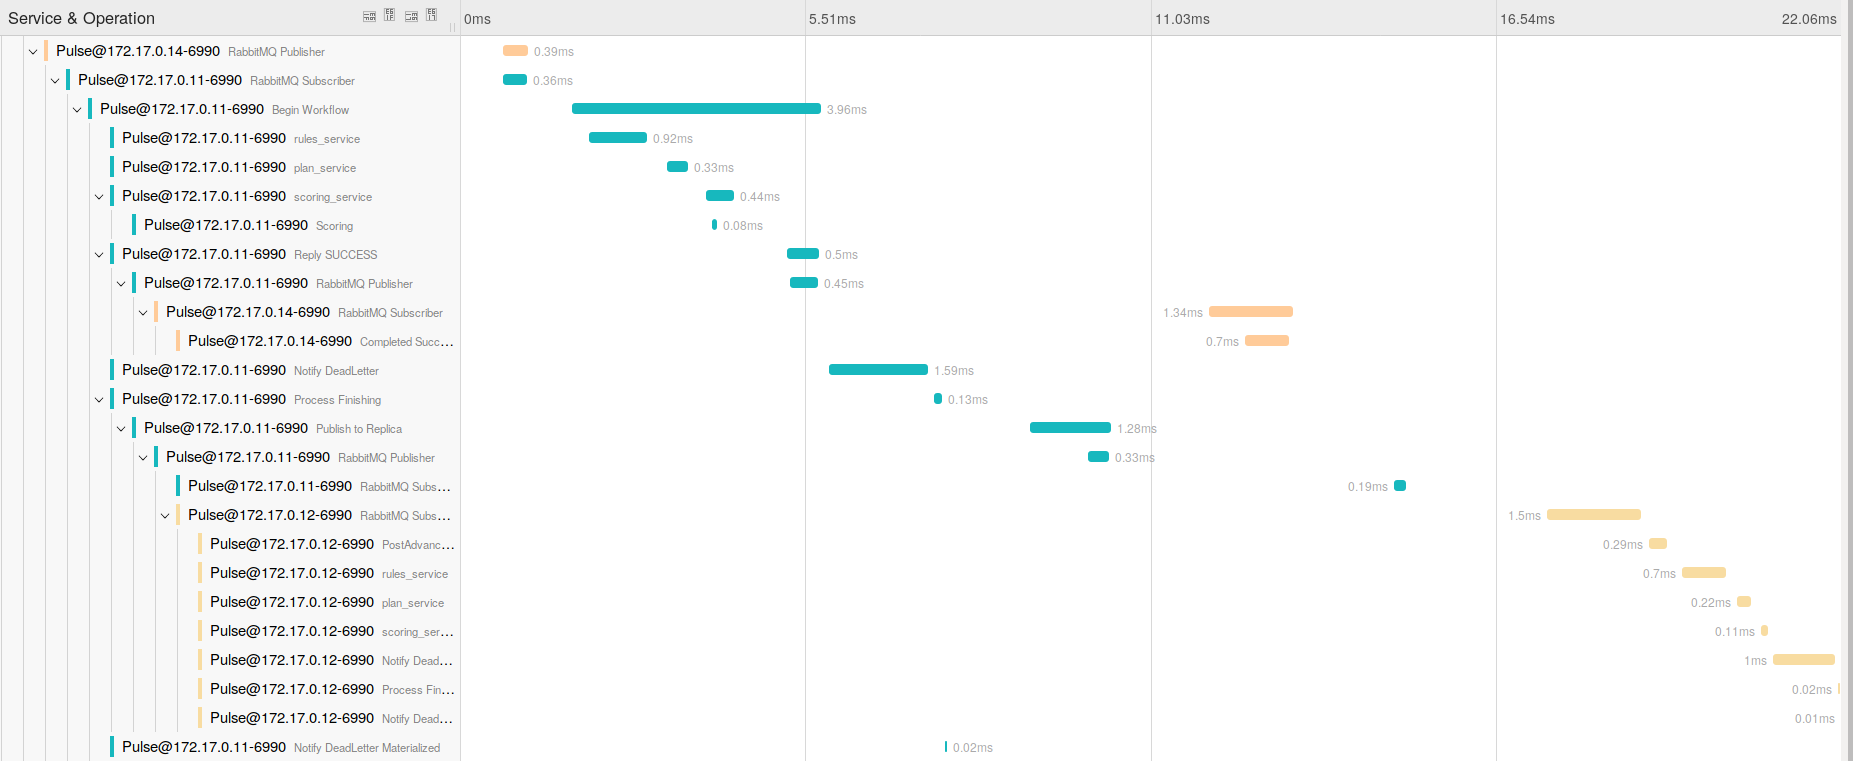
Visualization
The simplest way to view a trace is by looking at the span tree, however a Gantt Chart is the preferred visualization, as it shows both the causality relations between spans across time. Below is an example of a Gantt Chart that represents the trace of a request in Pulse.